



Dashboards
International project profitability
International project profitability
Available nowWe bring together your project, invoice and cost data to show which overseas projects, markets and partners are profitable once exchange-rate movement, travel, agent commission, withholding tax and bank charges are taken into account.
Who it's for: UK firms delivering projects or contracts abroad, and firms preparing to expand into new markets.
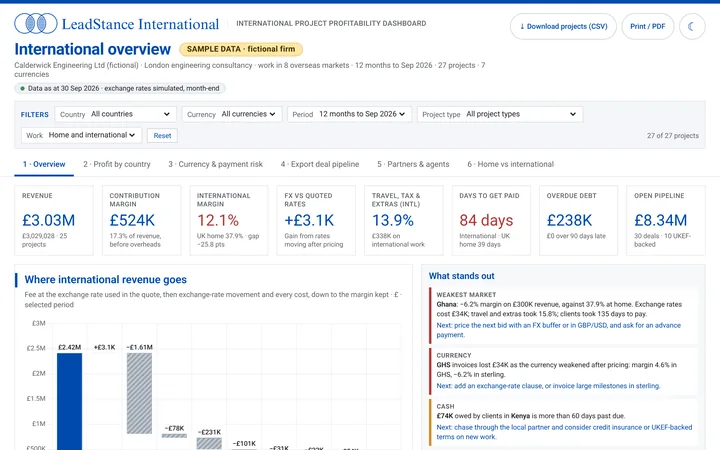
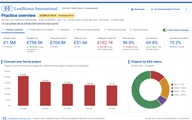
What the dashboard shows
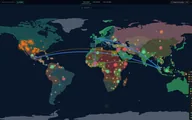
- Profit by country and market, after travel, currency and other extra costs
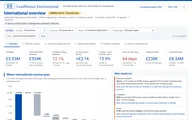
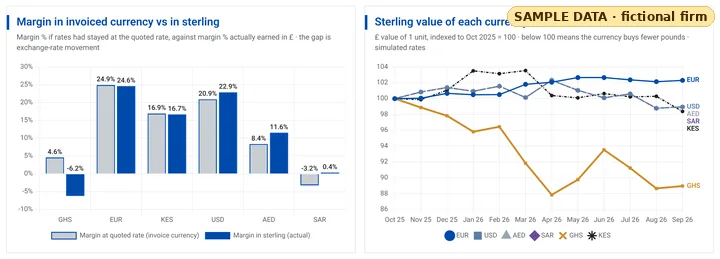
- Margin in the invoiced currency against margin in sterling, and the cost of a stronger pound on money still to come in
- Days to get paid against agreed terms, and money owed by age and country
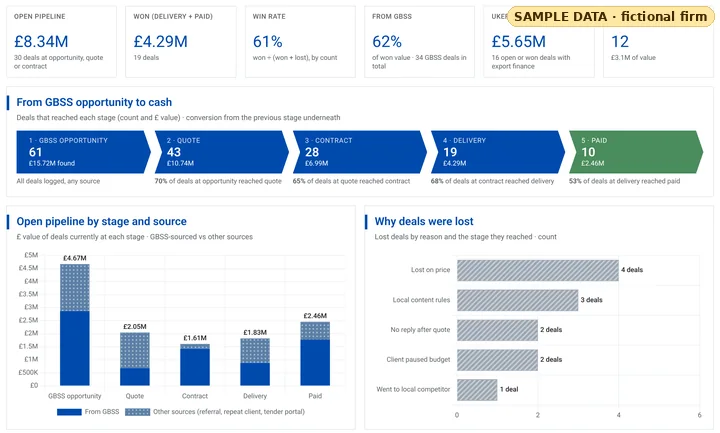
- The export deal pipeline from GBSS opportunity to payment, with deals backed by UK Export Finance (UKEF) flagged
- A scorecard for each overseas partner or agent: margin, days to pay, disputes and delays
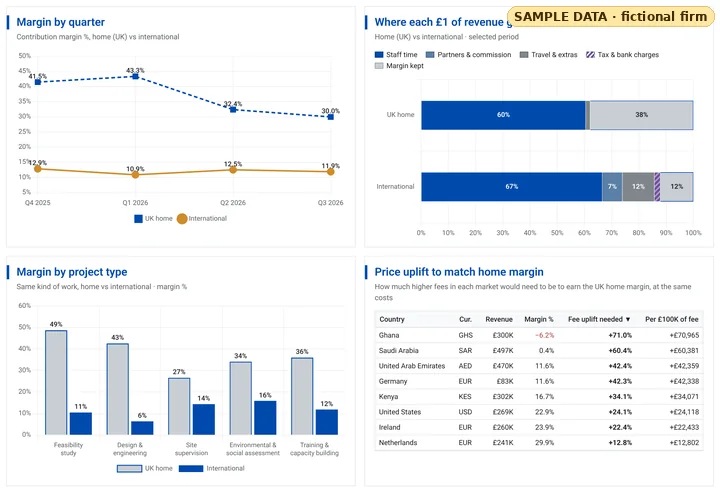
- Home and international margins side by side, and the fee uplift needed to match home margins
What we work from
The dashboard is built from information most firms already hold:
- Your project list or CRM, and signed contracts
- Xero or QuickBooks, including invoices, payments and bank fees
- Timesheets, for hours and cost rates
- Your opportunity log from GBSS or your CRM
- Partner and agent agreements
Margins are contribution margins: revenue less direct project costs, before office overheads.
Inside the dashboard
Sample data. Calderwick Engineering is a fictional firm; names, figures and exchange rates are invented.
Internationally
Working with GreenBridge SummitSync (GBSS)
GBSS helps you find partners and buyers abroad. The dashboard shows which of them are worth it, once the full cost of international delivery is counted.
Questions? Come and say hello.
Tell us a little about your business and we'll write back.